
")
")
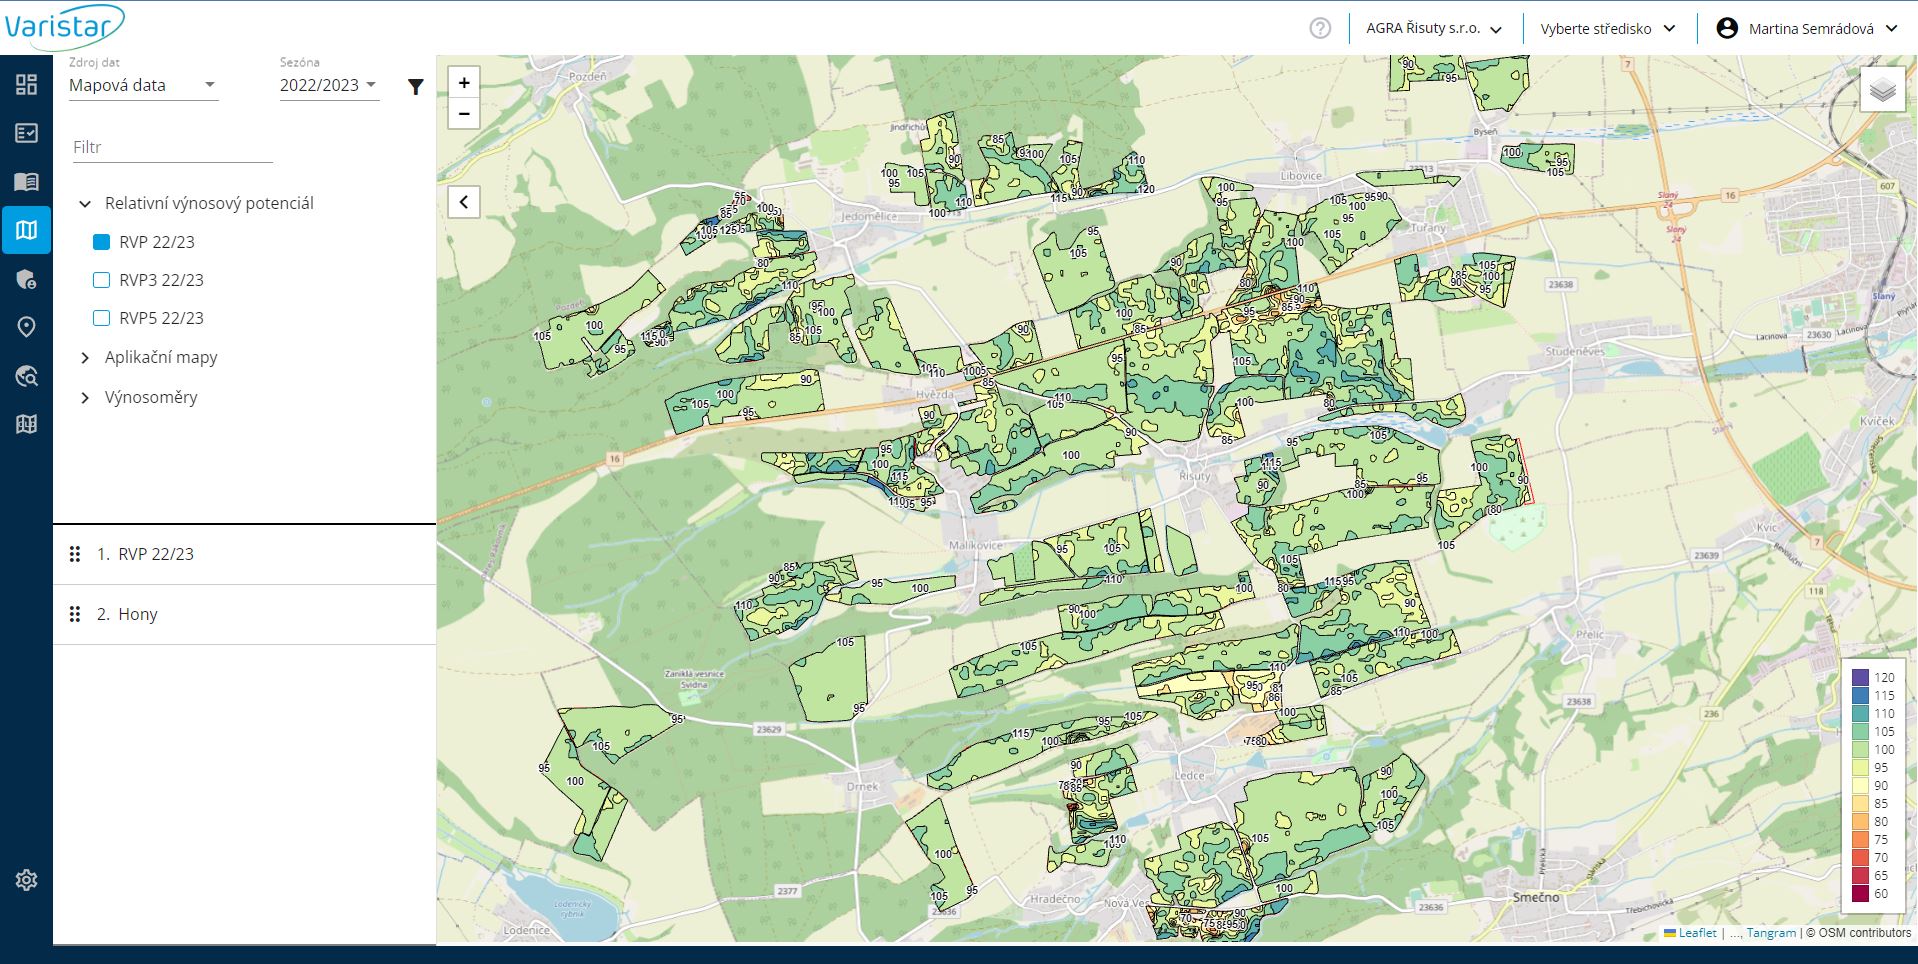
For our customers, we have developed the Varistar portal, which stores all data related to the farm and is continuously updated by new components and features.The original purpose of the Portal was to display map data - application maps, yield potential maps, Smart Scouting analysis or satellite imagery. Over time, however, the Portal has grown to include many other functionalities, such as the creation of application maps and their online transfer to application technology, historical yield analysis or even a fertilisation plan. Last but not least, the Portal processes all the necessary documents for precision farming subsidies at the click of a button.
After logging in to the Portal, clients will receive weather forecasts, information about current alerts from the agrorisk.cz website, the current situation according to the weather radar and data related to the created application maps. This initial screen can be changed according to the user's preferences.
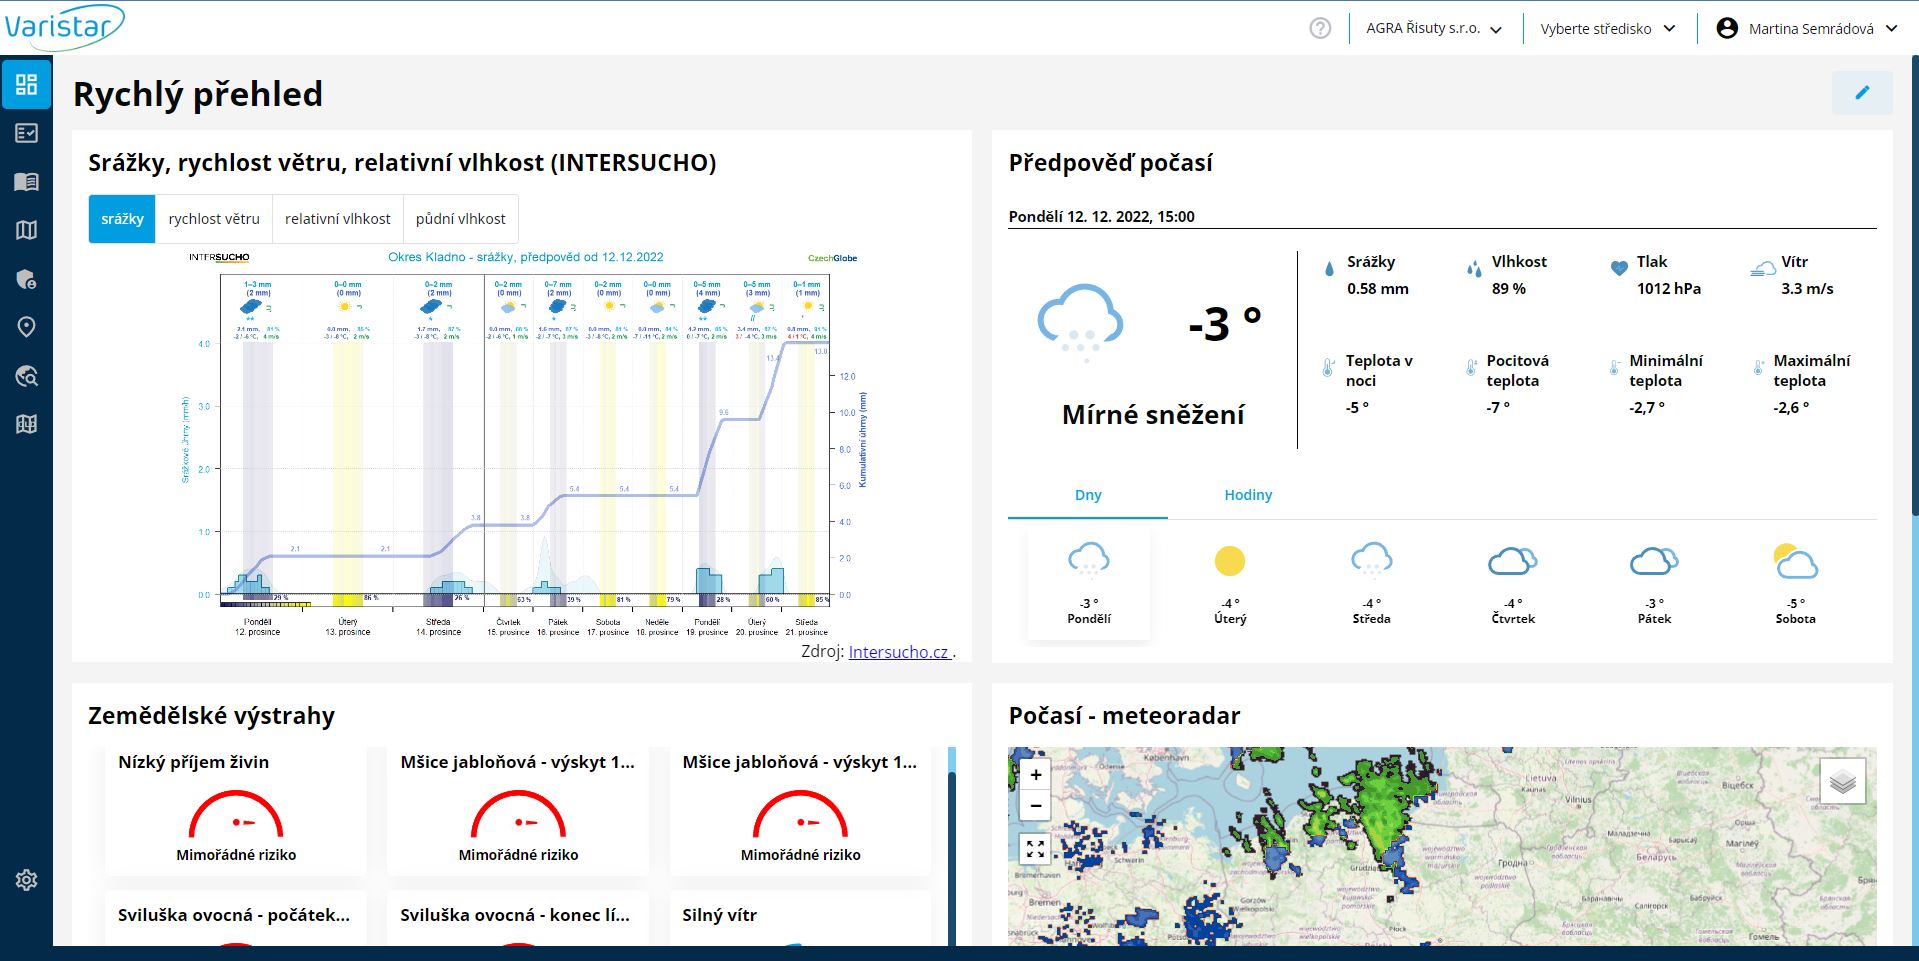
The user interface of the portal is very intuitive so that the portal is really used by agronomists. Creating application maps and transferring them to technology is a matter of minutes.
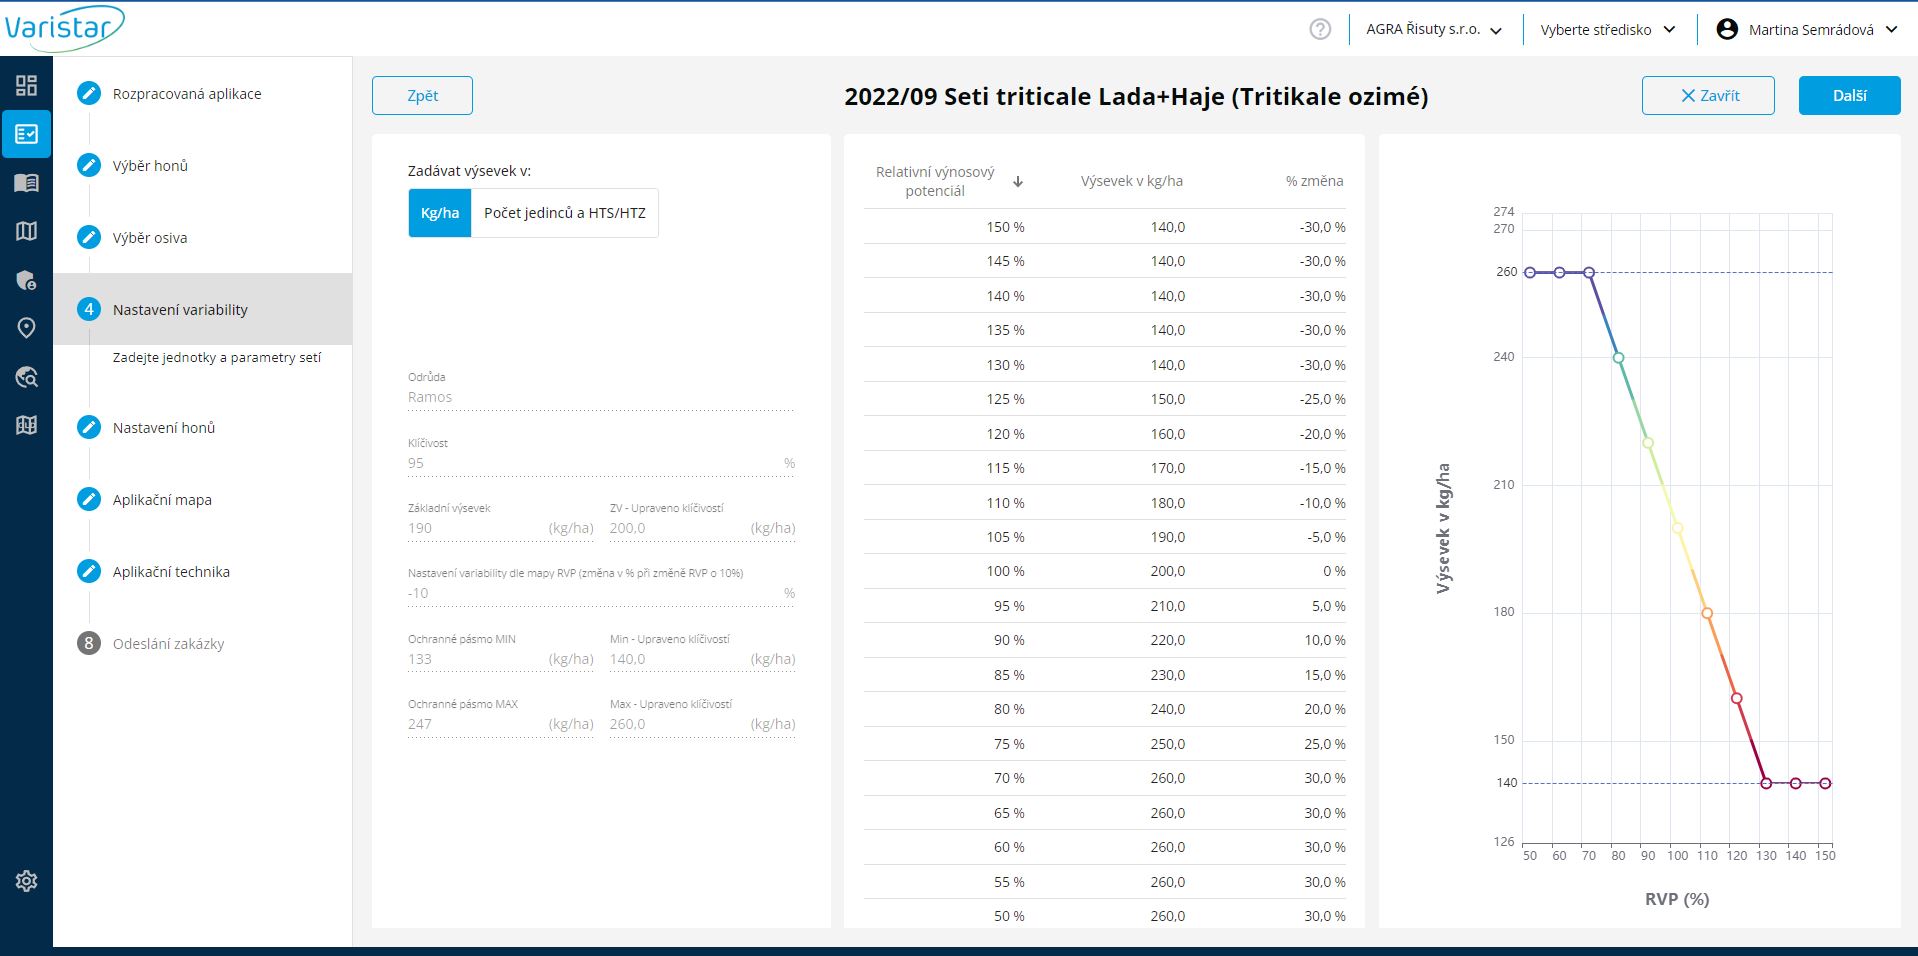
The portal serves as an excellent source of information and feedback for the agronomist. Based on the evolution of the measured stand condition, the agronomist can select the application strategy or identify problem zones for local field surveys. On the basis of the applications and their results, it is easy to evaluate the benefits of individual cultivation interventions and adjust their nature for future applications. All data is permanently stored in the portal, so it is easy to go back for any historical information.
Agricultural data is burdened with a high error rate. All information needs to be cleansed of such errors; it is not possible to use one algorithm that always follows the same procedure. Additional review of the outputs with an expert is needed for proper evaluation. There are a number of portals and automated systems on the market that use automated processing, but the validity of these data and their benefits tend to be very low. Our approach is that the partner for you is not a computer, but a human who takes care of your data and consults with you on the whole process of variable applications.
Our portal includes a portal of current satellite data. The satellite portal offers a plethora of ways to view and analyze hunting information. Our satellite portal integrates a complete database of all images taken by PlanetScope (3x3 m resolution), Landsat 8 and Sentinel 2 over the entire lifetime of the satellite constellations - so you have a view of your field going back several years.
The satellite portal offers many different vegetation indices that can be displayed in the viewer, so there is no need to stick to the best known NDVI (Normalized Difference Vegetation Index). It is possible to use the enhanced vegetation index (EVI), which can be used especially in the later stages of vegetation when the NDVI no longer provides sufficient resolution of the best zones, and the leaf area index (LAI). It can be defined as the leaf area occurring over a certain unit of soil surface. Thus, LAI = total leaf area in m2/ground area of 1 m2. A large number of palettes and settings are predefined in the portal to efficiently obtain a contour view for any stand.
Smart Scouting is one of the most important tools that our clients get. SmartScouting analysis evaluates current satellite data against the long-term normal and identifies risk zones in terms of vegetation development. It divides the production zones into 3 groups: below 90% of the long-term normal (problem sites), 90-110% of the long-term normal and above 110% of the long-term normal (potentially risky zones in terms of e.g. high fouling).
Smart Scouting helps the agronomist to search for places that are worth his attention and should be visited. Smart Scouting therefore does not tell you exactly what is happening at a given place, this is not possible to determine remotely. Zones that are not doing well may have been attacked by a disease or pest, there may have been more damage to the crop from wildlife, etc., zones that are doing above average may be excellent but may, on the other hand, have increased levels of weeds for example. Therefore, the role of the agronomist in evaluating the Smart Scouting evidence is irreplaceable.
However, Smart Scouting is the most important tool for optimizing variable applications. Thanks to the new Satellite Portal, it is possible to monitor the dynamics of stand development in each production zone, especially taking into account the variable applications made and their cultivation response in each zone. It is the only tool on the market that allows this and thus provides feedback for the deployment and subsequent optimisation of variable applications in the future. Analysis can also be generated for previous years and the development of individual soil blocks can be compared year-on-year.

If you are interested in a no-obligation consultation, please contact our team or fill out the short form and we will get back to you.

